
Post-event analytics is the systematic evaluation of event data collected after an event to measure success, attendee engagement, ROI, and areas of improvement for future events.
As we move ahead with the time, the role of technology in event management is becoming crucial day by day. Using data and analytics for a successful event is a must have for event professionals of the AI and digital era.
- What Is Post Event Analytics and Why It Matters
- Core Components of Post-Event Analytics
- Business Impact – Why Post Event Analytics Drives ROI
- Post Event Analytics vs Real-Time Event Analytics
- Why Post Event Analytics Is a Competitive Advantage in 2025
- Essential Metrics and KPIs for Post Event Analytics
- 1. Attendance & Participation Metrics
- 2. Attendee Engagement Metrics
- 3. Feedback, Satisfaction & NPS
- 4. Revenue, Leads & Event ROI Measurement
- 5. Content & Post-Event Digital Performance
- KPI Mapping by Event Objective
- Common KPI Mistakes (and How Top Teams Avoid Them)
- Best Tools for Post Event Analytics and Reporting
- 1) All-in-One Event Analytics Platforms
- CRM & Marketing Automation for ROI Attribution
- Engagement & On-Site Interaction Analytics
- Analytics Dashboards & Data Warehousing
- Integration & Automation Best Practices
- Common Tool Stack by Event Type
- Post Event Analytics Best Practices (Used by High-Performing Event Teams)
- 1. Start Analytics Planning Before the Event
- 2. Data Collection Strategy: Before, During & After the Event
- 3. Post Event Reporting: What Executives Actually Want
- 4. Turning Insights into Measurable Improvements
- 5. Best Practices Checklist (Field-Tested)
- Common Post Event Analytics Mistakes (Still Widespread)
- Frequently Asked Questions (FAQs) on Post Event Analytics
- What is post event analytics?
- What is the difference between real-time analytics and post event analytics?
- How soon after an event should post event analytics be completed?
- What are the most important post event analytics metrics?
- How do you calculate event ROI using post event analytics?
- What tools are commonly used for post event analytics?
- Why is post event analytics important for sponsors?
- What are the most common mistakes in post event analytics?
- Can post event analytics improve future events?
- Is post event analytics useful for small or free events?
What Is Post Event Analytics and Why It Matters
Post event analytics is the structured process of collecting, analyzing, and interpreting data after an event concludes to evaluate performance, attendee behavior, and business outcomes. The objective is not just reporting numbers—but converting data into decisions that improve future events, marketing ROI, and stakeholder confidence.
This definition aligns directly with industry frameworks used by organizations such as the Event Marketing Institute (EMI) and PCMA, which emphasize post-event measurement as a critical stage of the event lifecycle .

Core Components of Post-Event Analytics
Post event analytics is not a single report—it is a multi-layered evaluation system. High-performing event teams analyze five core data layers:
1. Attendance & Participation Data
- Registration vs. actual attendance
- Session check-ins
- Drop-off and no-show rates
According to Eventbrite, the average no-show rate for free events is 30–40%, while paid events average 10–15%, making attendance analysis critical for cost efficiency.
2. Attendee Engagement Metrics
- Session duration
- Polls, Q&A, and live interactions
- Social wall participation
- Networking activity
A Bizzabo Event Benchmark Report found that events with interactive elements (polls, live Q&A, networking) experience 33% higher attendee satisfaction scores.
3. Feedback & Sentiment Analysis
- Post-event surveys
- Net Promoter Score (NPS)
- Qualitative feedback comments
Net Promoter Score is widely adopted across enterprise events. According to Satmetrix, the average NPS for B2B events ranges between 30–40, while best-in-class events exceed 50.
Source:
4. Revenue, Leads & ROI Attribution
- Cost per attendee
- Cost per lead
- Revenue influenced or closed
- Sponsor ROI
The Event Marketing Institute reports that 79% of marketers generate sales from events, but only 23% consistently track event ROI, highlighting a massive optimization gap.
Source:
5. Content & Digital Performance
- On-demand session views
- Email follow-up engagement
- Website traffic spikes
- Social media reach and UGC volume
Hybrid and virtual events extend lifecycle value. HubSpot data shows that gated event content generates leads up to 6 months post-event. This increases a need of professional virtual event engagement tool for every hybrid event.
Business Impact – Why Post Event Analytics Drives ROI
Organizations that treat post-event analytics as a strategic function—not an afterthought—outperform competitors.
Proven Business Benefits
| Impact Area | Real-World Outcome |
|---|---|
| Budget optimization | Reduced spend on low-performing sessions and formats |
| Experience design | Data-backed agenda and speaker selection |
| Sponsorship revenue | Clear sponsor ROI reporting increases renewals |
| Sales alignment | Stronger attribution between events and pipeline |
| Executive buy-in | Data-driven reporting builds leadership trust |
Real-World Example: Salesforce Dreamforce
Salesforce uses post-event analytics to evaluate:
- Session attendance heatmaps
- App engagement
- Content consumption post-event
This data directly informs agenda planning for the following year and sponsor pricing tiers.
Post Event Analytics vs Real-Time Event Analytics
While often confused, these serve distinct purposes:
| Aspect | Real-Time Analytics | Post Event Analytics |
|---|---|---|
| Timing | During event | After event |
| Focus | Tactical fixes | Strategic insights |
| Decisions | On-the-fly | Long-term optimization |
| Stakeholders | Ops team | Marketing, sales, leadership |
Best-in-class event teams use both, but post-event analytics is where ROI is proven and future strategy is shaped.
Why Post Event Analytics Is a Competitive Advantage in 2025
According to Skift Meetings, over 70% of event professionals plan to increase their investment in analytics and data tools due to rising stakeholder expectations.
Source:
Key drivers:
- CFO demand for ROI justification
- Data-led sponsorship renewals
- AI-powered personalization
- Hybrid and multi-touchpoint events
Essential Metrics and KPIs for Post Event Analytics
Once an event concludes, raw data alone has little value unless it is translated into standardized KPIs that decision-makers understand. High-performing event teams focus on five KPI categories, each tied to a specific business outcome.
1. Attendance & Participation Metrics
These metrics determine whether your event attracted the right audience and whether your promotion, pricing, and timing were effective.
Key Metrics to Track
Attendance Rate (%)
(Number of Attendees ÷ Number of Registrations) × 100
No-Show Rate (%)
(Number of Registrations − Attendees) ÷ Registrations × 100
Session Attendance Rate
Session Attendees ÷ Total Event Attendees
Industry Benchmarks
- Free events: 30–40% no-show rate
- Paid B2B events: 10–15% no-show rate
- Hybrid events typically show higher drop-offs for virtual-only sessions
Source: Eventbrite
Real-World Use Case
Google Cloud Next uses attendance heatmaps to identify:
- Overcrowded sessions → repeat next year
- Low-attendance tracks → eliminate or reposition
This data directly informs agenda planning and venue sizing decisions.
2. Attendee Engagement Metrics
Attendance shows who showed up. Engagement shows who actually participated.
Core Engagement KPIs
- Average session duration
- Poll participation rate
- Q&A submissions per session
- Networking interactions
- Social wall posts & UGC volume
Engagement Rate Formula
(Engaged Attendees ÷ Total Attendees) × 100
Why This Matters
According to Bizzabo’s Event Benchmarks Report, events with high engagement scores see:
- 33% higher attendee satisfaction
- 20% higher sponsor renewal rates
Case Study: HubSpot INBOUND
HubSpot measures engagement across:
- Session check-ins
- Live Q&A activity
- Post-event content consumption
Engagement data is later correlated with CRM pipeline influence.
3. Feedback, Satisfaction & NPS
Post-event feedback transforms qualitative sentiment into quantitative insights.
Key Feedback Metrics
Net Promoter Score (NPS)
% Promoters − % Detractors
CSAT (Customer Satisfaction Score)
(Number of Satisfied Responses ÷ Total Responses) × 100
Industry Benchmarks
- Average B2B event NPS: 30–40
- High-performing events: 50+
Source: Satmetrix NPS Benchmarks
Best Practice
Top organizers send surveys:
- Within 24–48 hours
- With 5–7 questions max
- Including one open-ended qualitative question
This timing increases response rates by up to 40%, according to SurveyMonkey research.
4. Revenue, Leads & Event ROI Measurement
This is where post-event analytics becomes boardroom-relevant.
Core Revenue Metrics
- Cost per attendee
- Cost per lead (CPL)
- Pipeline influenced
- Revenue closed
- Sponsor ROI
Event ROI Formula
[(Revenue Attributed − Total Event Cost) ÷ Total Event Cost] × 100
Industry Reality Check
- 79% of marketers say events drive sales
- Only 23% consistently measure event ROI
Source: Event Marketing Institute
Case Study: IBM Think Conference
IBM links:
- Badge scans
- Session attendance
- Content downloads
…directly to Salesforce CRM, enabling full-funnel ROI attribution.
Source: IBM
5. Content & Post-Event Digital Performance
Modern events don’t end on the last day—they continue through content.
Metrics to Track
- On-demand session views
- Email open & CTR rates
- Website traffic spikes
- Social reach & impressions
- UGC reuse across marketing
Supporting Data
HubSpot reports that event-related content generates leads for up to 6 months post-event, especially gated recordings and recap blogs.
KPI Mapping by Event Objective
| Event Objective | Primary KPIs |
|---|---|
| Brand awareness | Reach, impressions, social mentions |
| Lead generation | CPL, MQLs, pipeline influenced |
| Sales enablement | Deal velocity, revenue closed |
| Community building | Engagement rate, NPS, retention |
| Sponsorship ROI | Booth traffic, lead quality, renewals |
Common KPI Mistakes (and How Top Teams Avoid Them)
❌ Tracking vanity metrics only
❌ No CRM or marketing automation integration
❌ Reporting data without recommendations
❌ Ignoring qualitative feedback
✅ High-performing teams:
- Align KPIs to pre-event goals
- Standardize reports across events
- Compare YoY and event-to-event benchmarks
- Convert insights into action plans
Best Tools for Post Event Analytics and Reporting
The most effective post-event analytics stacks combine event data, engagement signals, and revenue attribution into a single reporting flow. In practice, teams use one of three approaches:
- All-in-one event platforms
- Modular stacks (event tool + CRM + analytics)
- Enterprise data warehouses (for large-scale events)
Below is a practical, use-case driven comparison.
1) All-in-One Event Analytics Platforms
These platforms capture registrations, attendance, engagement, and reporting natively—ideal for teams that want speed and simplicity.
Eventbrite Analytics
Best for: Ticketed events, workshops, community meetups
What it tracks
- Registrations vs attendance
- Ticket revenue
- Geographic and demographic insights
- Marketing channel attribution
Proof point
Eventbrite publishes aggregated attendance and engagement benchmarks via its Event Data Lab, widely cited by marketers and planners.
Source: https://www.eventbrite.com/blog/event-data-lab/
Limitation
- Limited engagement depth (polls, Q&A, networking)
- Requires external tools for CRM-level ROI
Bizzabo
Best for: B2B conferences, enterprise events, hybrid formats
What it tracks
- Session-level engagement
- Attendee journeys
- Sponsor interactions
- Event-level benchmarks
Real-world usage
Bizzabo’s platform is used by companies like HubSpot and Forbes for data-driven event optimization.
Source: https://www.bizzabo.com/customers/
Strength
- Strong post-event dashboards
- Built-in benchmarking across events
PheedLoop
Best for: Academic conferences, associations, multi-track events
What it tracks
- Session attendance
- Abstract & speaker engagement
- Exhibitor analytics
- Post-event reporting exports
Advantage
Highly granular session-level reporting—especially valuable for conferences with complex agendas.
Source: https://pheedloop.com/features/
CRM & Marketing Automation for ROI Attribution
To measure true event ROI, post-event analytics must extend beyond the event platform.
Salesforce
Role in post-event analytics
- Lead capture and scoring
- Pipeline attribution
- Revenue influence reporting
Real-world case
IBM Think Conference integrates event attendance data directly into Salesforce to track influenced pipeline and closed deals.
Why it matters
Sales teams trust CRM data more than standalone event reports—making Salesforce integration critical for executive reporting.
HubSpot
Role
- Email follow-ups
- Lead nurturing
- Post-event content tracking
Verified data
HubSpot reports that event-driven campaigns generate engagement and leads months after the event, especially through on-demand content.
Best use
Combine event attendance + content consumption to measure post-event buyer intent.
Engagement & On-Site Interaction Analytics
These tools measure what attendees actually did, not just whether they showed up.
Event Apps & Engagement Platforms
- Session check-ins
- Live polling
- Q&A activity
- Networking behavior
Industry insight
According to PCMA, events using interactive audience engagement tools see significantly higher satisfaction and repeat attendance.
Social Walls & UGC Analytics (Use-Case Driven)
Social Walls contribute measurable post-event data, including:
- UGC volume
- Reach and impressions
- Engagement per post
- Content reuse potential
Why this matters
UGC-driven events consistently outperform traditional events on:
- Engagement
- Brand recall
- Sponsor visibility
Stacking social wall analytics with event KPIs provides both qualitative and quantitative insight.
Analytics Dashboards & Data Warehousing
For large organizers, exporting data into BI tools enables cross-event intelligence.
Common Stack
Insights
Enterprise organizers increasingly centralize event data alongside marketing and sales data to justify spend and scale smarter.
Integration & Automation Best Practices
Recommended Data Flow
Event Platform
→ Engagement Tools
→ CRM
→ Marketing Automation
→ Analytics Dashboard
Automation Benefits
- Faster reporting (hours instead of weeks)
- Fewer manual errors
- Consistent stakeholder dashboards
- Scalable analytics for recurring events
Common Tool Stack by Event Type
| Event Type | Recommended Stack |
|---|---|
| Corporate conference | Bizzabo + Salesforce + HubSpot |
| Trade show | Event platform + badge scanning + CRM |
| Community events | Eventbrite + email automation |
| Hybrid events | Event app + engagement tools + BI |
| Sponsored events | Event platform + Social Walls analytics |
Post Event Analytics Best Practices (Used by High-Performing Event Teams)
Successful organizers don’t “analyze later.” They design analytics before the event begins and execute it systematically after the event ends.
Industry bodies like PCMA and Event Marketing Institute consistently emphasize that post-event measurement must be planned upstream to be meaningful seo-outline-post-event-analytic….
1. Start Analytics Planning Before the Event
Why this matters
If KPIs are defined after the event, data gaps are inevitable—and ROI becomes guesswork.
Best Practice Framework
Before launch, define:
- Primary event objective (brand, leads, sales, community)
- 5–7 success KPIs only (avoid metric overload)
- Data sources for each KPI
- Ownership (who collects, who analyzes, who reports)
Real-World Insight
Organizations that define success metrics before the event are 2× more likely to prove ROI to leadership.
2. Data Collection Strategy: Before, During & After the Event
A. Before the Event
What to capture
- Registration source & campaign attribution
- Attendee profiles & intent
- Pre-event engagement (emails, landing pages)
Why
Pre-event data creates a baseline to measure lift, engagement growth, and conversion velocity.
B. During the Event
What to capture
- Attendance check-ins
- Session participation
- Engagement interactions (polls, Q&A, social walls)
- Booth visits or sponsor interactions
Best practice
Avoid over-collection. Focus on behavioral signals that indicate intent or value, not just activity volume.
Industry guidance
PCMA research shows that events capturing behavioral engagement data outperform survey-only measurement models in predicting future attendance and satisfaction.
C. Post-Event Analytics
What to capture
- Surveys (NPS + qualitative feedback)
- Content consumption (on-demand views)
- Sales & pipeline movement
- Social & UGC reuse metrics
Timing rule
- Surveys: within 24–48 hours
- Preliminary analytics: 48–72 hours
- Final report: 7–14 days
- Revenue attribution: 30–90 days
This timeline aligns with industry-standard post-event evaluation windows seo-outline-post-event-analytic….
3. Post Event Reporting: What Executives Actually Want
One of the biggest failures in post-event analytics is over-reporting and under-explaining.
What Not to Do
❌ 40-slide reports
❌ Raw dashboards without insights
❌ Metrics without benchmarks
❌ No recommendations
Executive-Ready Report Structure
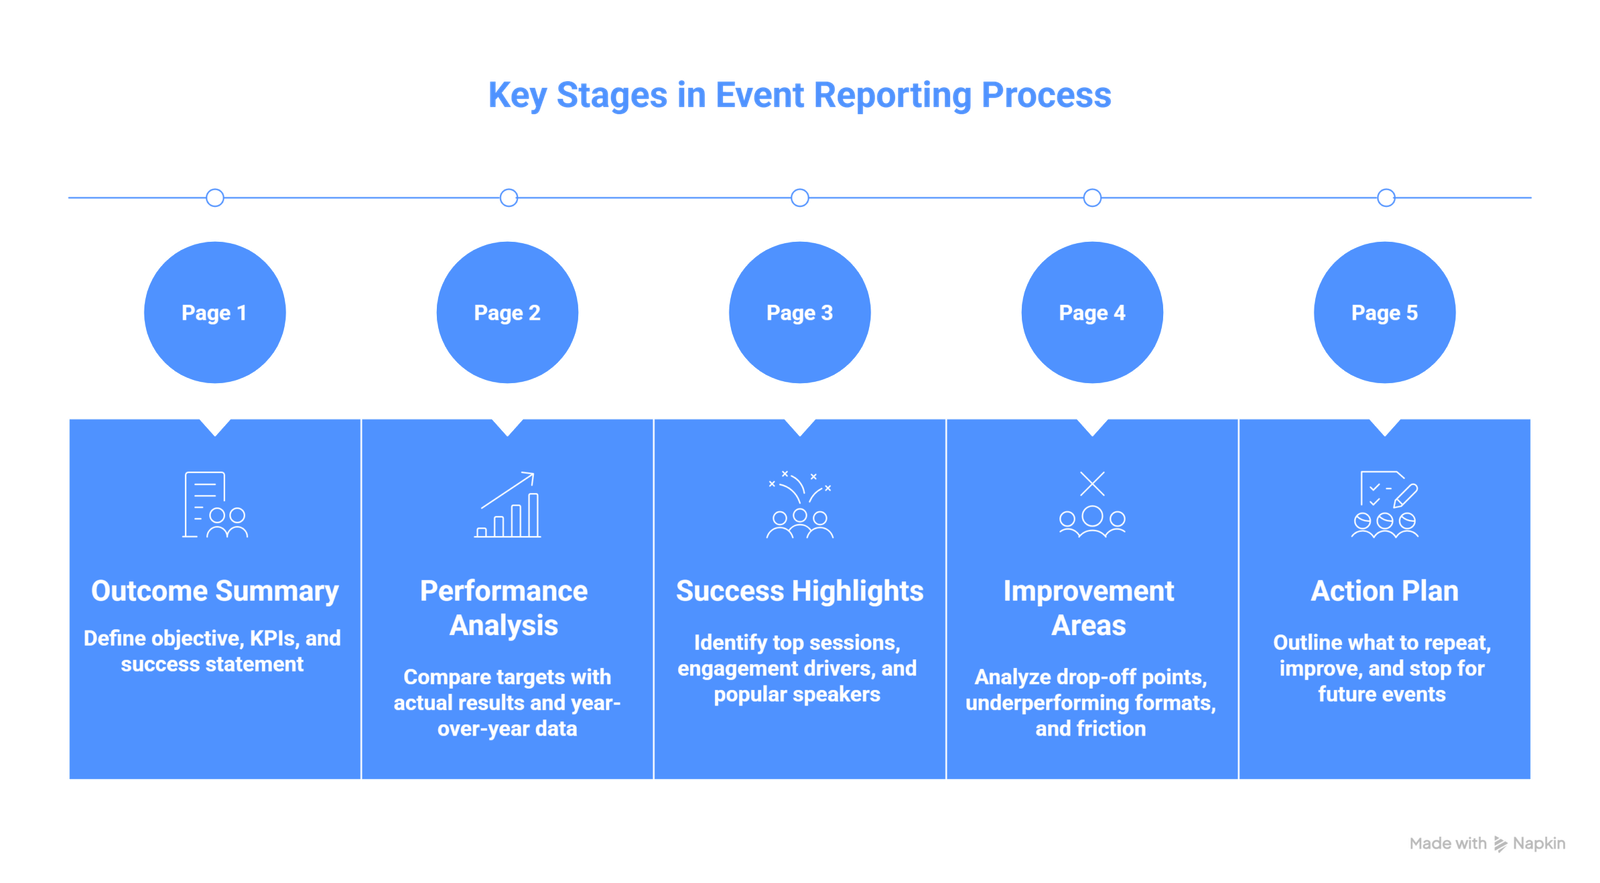
Page 1: Event Outcome Summary
- Event objective
- Top 3 KPIs
- One-sentence success statement
Page 2: Performance vs Goal
- Target vs actual
- YoY or event-to-event comparison
Page 3: What Worked
- High-performing sessions
- Engagement drivers
- Content or speakers with strongest response
Page 4: What Didn’t
- Drop-off points
- Underperforming formats
- Audience friction points
Page 5: Action Plan
- What to repeat
- What to improve
- What to stop next time
This structure mirrors post-event evaluation models promoted by professional event associations seo-outline-post-event-analytic….
4. Turning Insights into Measurable Improvements
Post-event analytics only delivers ROI when insights are operationalized.
Example: Engagement Optimization Loop
- Identify low-engagement sessions
- Analyze timing, format, and topic
- Adjust agenda structure
- Test improvement at next event
- Compare engagement deltas
Real-World Pattern
B2B organizers using this loop consistently report:
- Higher session attendance
- Better agenda flow
- Improved NPS over time
5. Best Practices Checklist (Field-Tested)
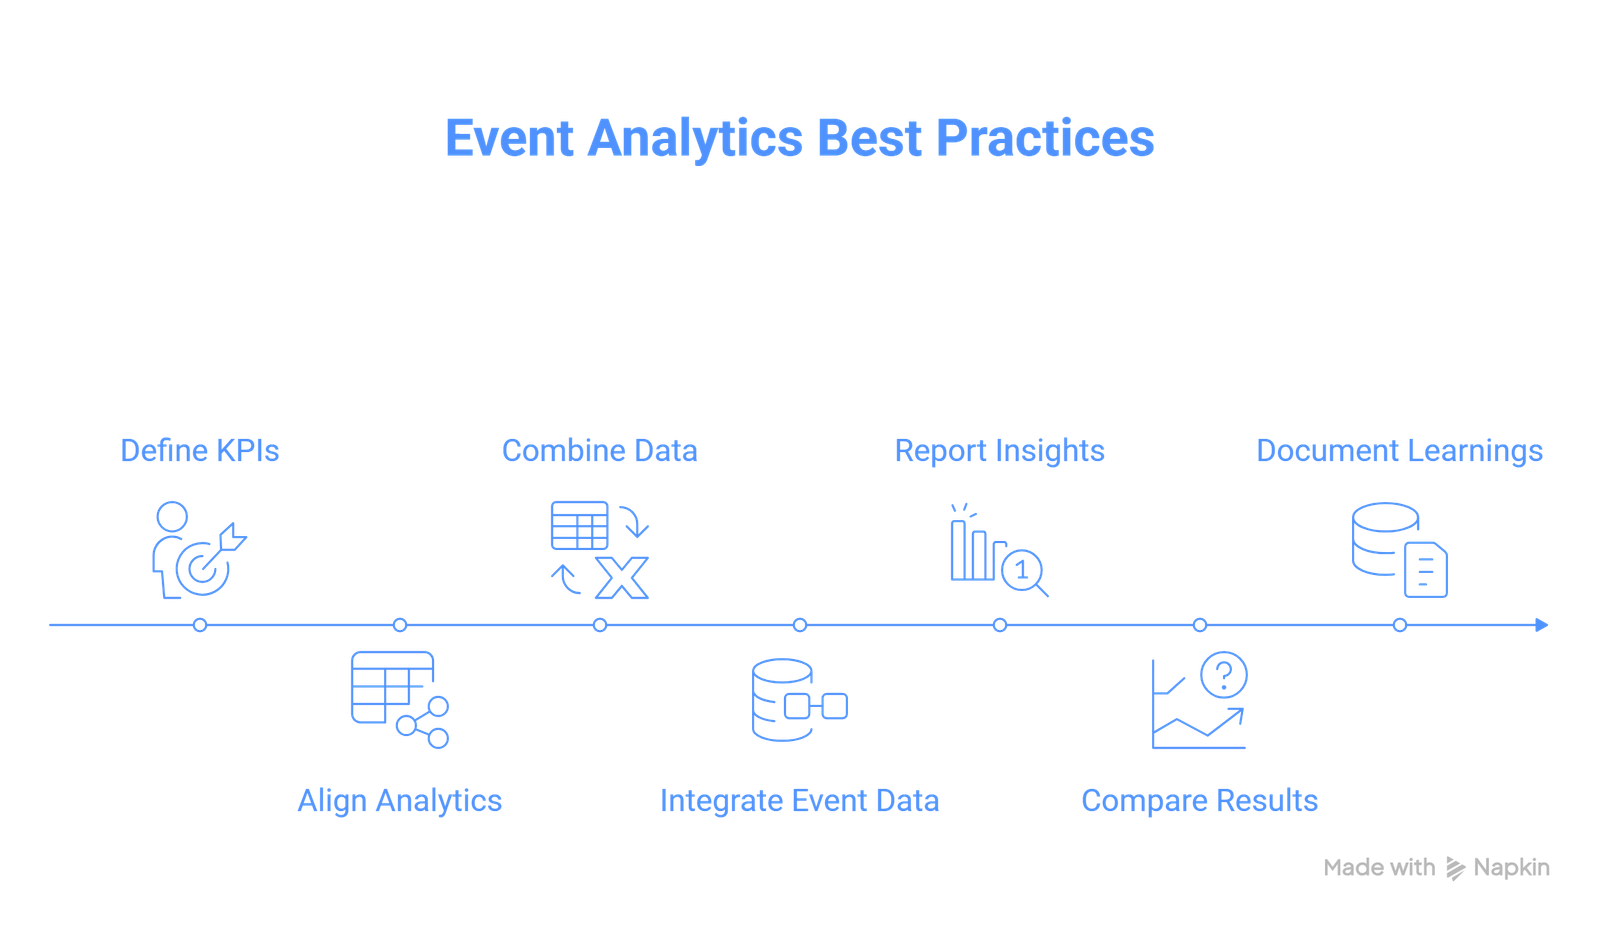
✅ Define KPIs before launch
✅ Align analytics to business goals
✅ Combine quantitative + qualitative data
✅ Integrate event data with CRM
✅ Report insights, not just metrics
✅ Compare results across events
✅ Document learnings for next cycle
Common Post Event Analytics Mistakes (Still Widespread)
| Mistake | Impact |
|---|---|
| Measuring everything | No clear insight |
| No CRM integration | ROI not trusted |
| Late surveys | Low response rates |
| No benchmarks | No context |
| No action plan | No improvement |
These gaps are consistently cited in post-event measurement studies.
Frequently Asked Questions (FAQs) on Post Event Analytics
What is post event analytics?
Post event analytics is the process of collecting, analyzing, and interpreting data after an event concludes to evaluate performance, attendee behavior, engagement levels, and return on investment (ROI). It helps organizers identify what worked, what didn’t, and how to improve future events.
This definition aligns with post-event evaluation frameworks promoted by professional event bodies such as PCMA and the Event Marketing Institute .
What is the difference between real-time analytics and post event analytics?
Real-time analytics track live data during an event (attendance, engagement, technical issues) to enable immediate adjustments.
Post event analytics analyze complete datasets after the event to generate strategic insights, calculate ROI, and guide long-term improvements.
Both are complementary, but post-event analytics is essential for executive reporting, budget justification, and future planning .
How soon after an event should post event analytics be completed?
Best-practice timelines are:
- Within 24–48 hours: Send attendee feedback surveys
- Within 48–72 hours: Compile preliminary performance metrics
- Within 7–14 days: Deliver final post-event report
- Within 30–90 days: Complete revenue and pipeline attribution
This staged approach is recommended in professional post-event evaluation models to balance accuracy and actionability .
What are the most important post event analytics metrics?
The most important metrics depend on event goals, but commonly include:
- Attendance rate and no-show rate
- Session engagement and participation
- Net Promoter Score (NPS)
- Cost per attendee or cost per lead
- Leads generated and pipeline influenced
- Sponsor engagement and ROI
- Content consumption after the event
Industry research shows that events tracking both engagement and business impact metrics outperform those relying only on surveys or attendance counts .
How do you calculate event ROI using post event analytics?
A standard event ROI formula is:[(Revenue Attributed − Total Event Cost) ÷ Total Event Cost] × 100
Revenue attribution may include:
Closed deals
Influenced pipeline
Sponsor revenue
Long-term customer value (for recurring events)
The Event Marketing Institute reports that while most marketers believe events drive revenue, only a minority measure ROI consistently—making this calculation a competitive advantage .
What tools are commonly used for post event analytics?
Post event analytics typically uses a combination of:
- Event management platforms (registration, attendance, engagement)
- CRM systems (lead and revenue tracking)
- Marketing automation tools (follow-up and content engagement)
- Analytics dashboards or BI tools (cross-event reporting)
Best results come from integrating event data with CRM and marketing systems, rather than relying on a single platform .
Why is post event analytics important for sponsors?
Post event analytics provides sponsors with:
- Verified audience reach
- Engagement data (booth visits, interactions)
- Lead quantity and quality
- Content and brand exposure metrics
Clear sponsor analytics significantly improves renewal rates and sponsorship value justification, according to industry sponsorship measurement practices .
What are the most common mistakes in post event analytics?
The most frequent mistakes include:
- Tracking too many metrics without clear goals
- Sending surveys too late
- Not integrating event data with CRM systems
- Reporting data without insights or recommendations
- Failing to benchmark results across events
Professional event frameworks emphasize that analytics must lead to decisions and improvements, not just reports .
Can post event analytics improve future events?
Yes. When applied consistently, post event analytics helps organizers:
- Design better agendas and session formats
- Improve attendee experience and satisfaction
- Optimize budgets and resource allocation
- Increase sponsor ROI and retention
- Demonstrate measurable business impact
Organizations that treat post-event analytics as a continuous improvement loop consistently achieve higher engagement and ROI over time .
Is post event analytics useful for small or free events?
Absolutely. Even small or free events benefit from post-event analytics by tracking:
- Attendance vs registrations
- Engagement levels
- Feedback and sentiment
- Content performance
Scalable analytics practices allow organizers to build data maturity over time, regardless of event size .